Lithium Ion Battery Experiments at Home and at Swansea University
Objective of These Experiments
The Objective of this set of experiments was to explore and gain insight into the Endothermic Electric Effect that is seen during the lithium battery charge but with a different approach not yet identified by the USW and NASA experiments.
There were 3 tests carried out that i include here in this chapter, as they have substance worthy of discussion and important traits that reveal electric field charge characteristics.
NASA and USW had purpose-built facilities for the charging and monitoring of the electric field. There was no purpose-built testing equipment at hand in Swansea. Therefore, a circuit was designed as shown. I on purposely did not size wires as this would be different to experiments already seen, USW and NASA.
Circuit Design
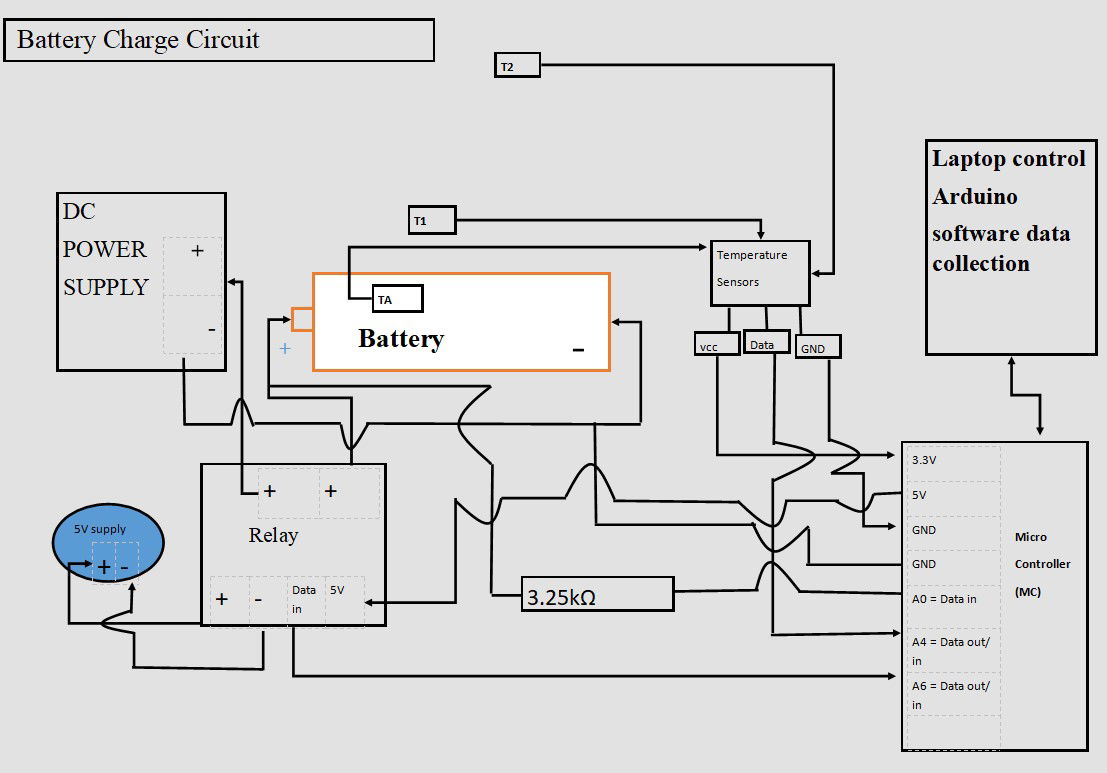
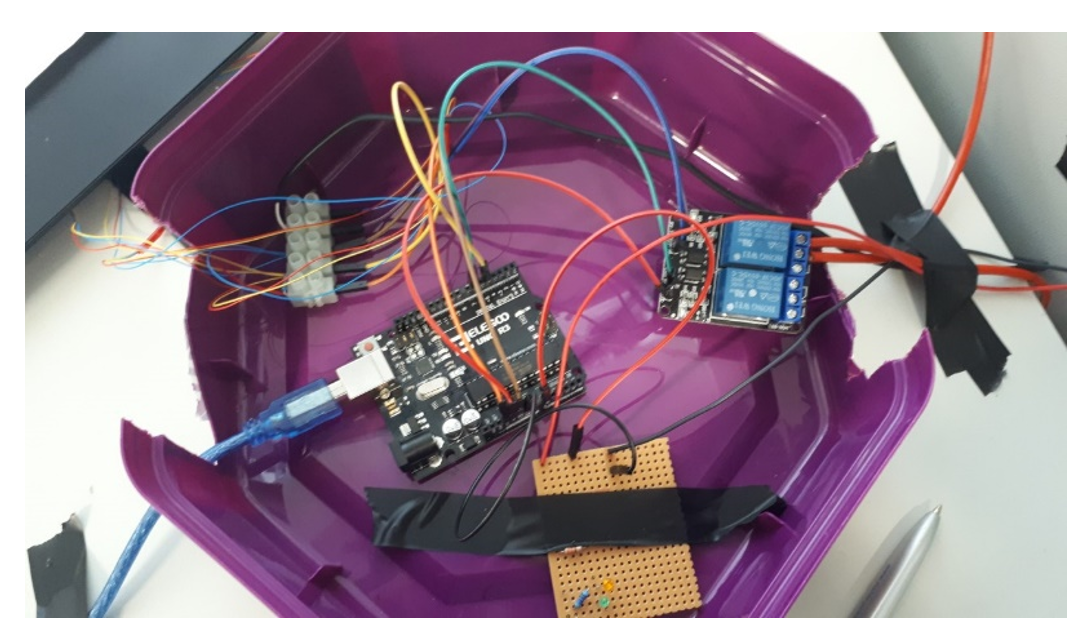
- The Elegoo Uno R3 Microcontroller (M.C) is suitable with Arduino software and is used to control the circuit
- Dallas temperature sensors 3 of, are used. A 4K7 ohm pull up resistor is required on the Data acquisition pin to pull it up to 5V to ensure operating through the one wire data acquisition.
- A4 = Digital input for the temp sensors and outputted data through serial monitor.
- A0 = This is an analogue to digital converter input on the M.C. The rising voltage in the battery is recorded through the 3.25KΩ resistor.
- The data is collected and read in the serial monitor of the Arduino during the charge cycle.
- Graphs were generated using excel.
- A6 = Digital output control to Relay for high or low operation of charge circuit on M.C.
- The power supply on/off is controlled through this high-current relay; DC30V 10A. Equipped with indication LED’s for Relay output status. With software code seen through digital pin13. The relay is driven with a separate 5V power supply.
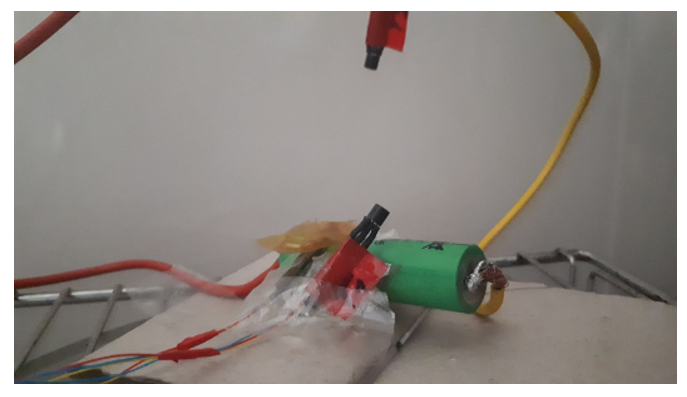
Swansea Test Experiment 8
Taped to Battery temperature sensor = TA
10mm from battery temperature sensor = T1
Ambient temperature sensor 17cm from battery = T2
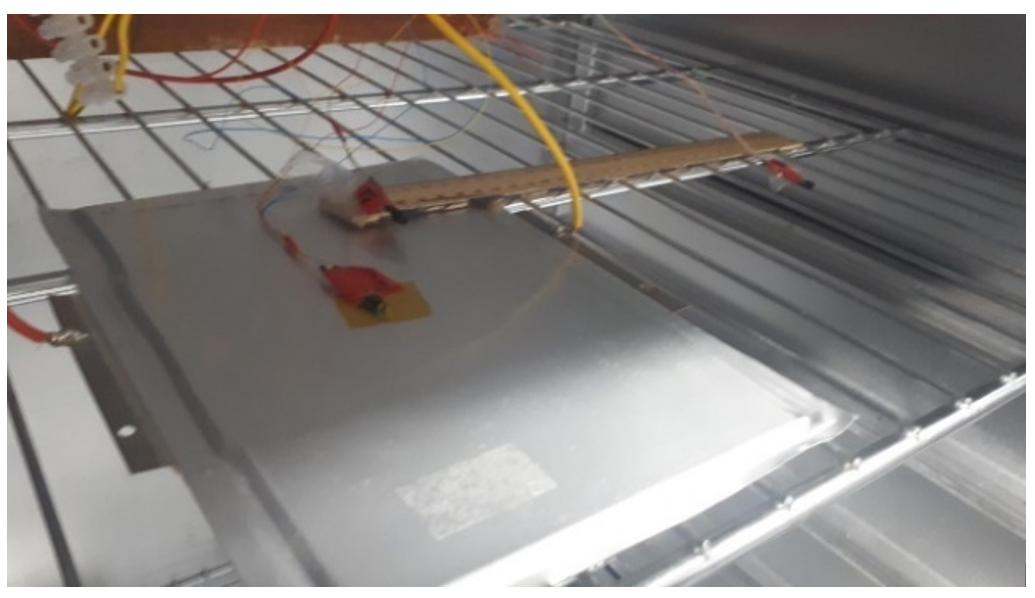
This battery was selected due to its similar amp hour size as the A123 battery used in USW experiments. As you can see the wires for current and voltage are not sized like seen in the USW experimental set up.
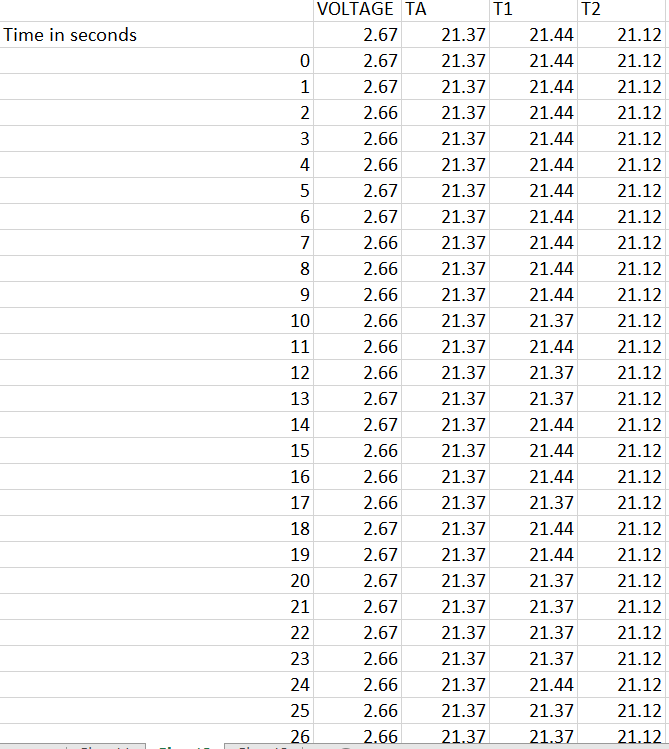
As one will notice from the Swansea graph below, there is a time recorded data included before the C2 9amp per second charge was initiated.
This data that is shown below reveals some characteristics of the charge. TA and T1 show a higher temperature than T2 the ambient room temperature. before charged is engaged. This can be explained: there is some voltage in the battery and there is already a lower pressure surrounding the battery due to attraction of electrons to the lithium ions.
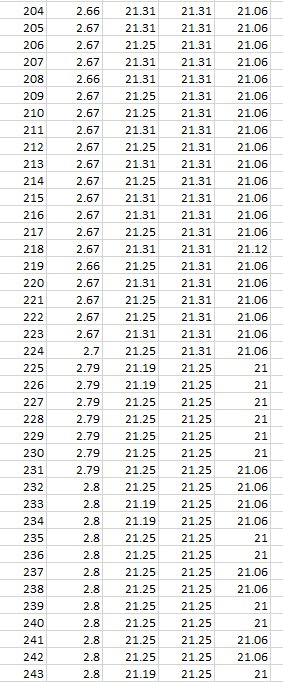
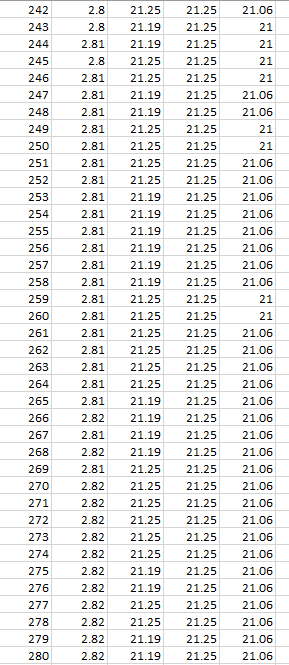
One will notice how all temperature sensors record a drop in temperature at 225 seconds, (table 2). At 17 cm from battery T2 records temperature drop.
T2 shows constant temperature throughout experiment other than when the charge is first initiated.
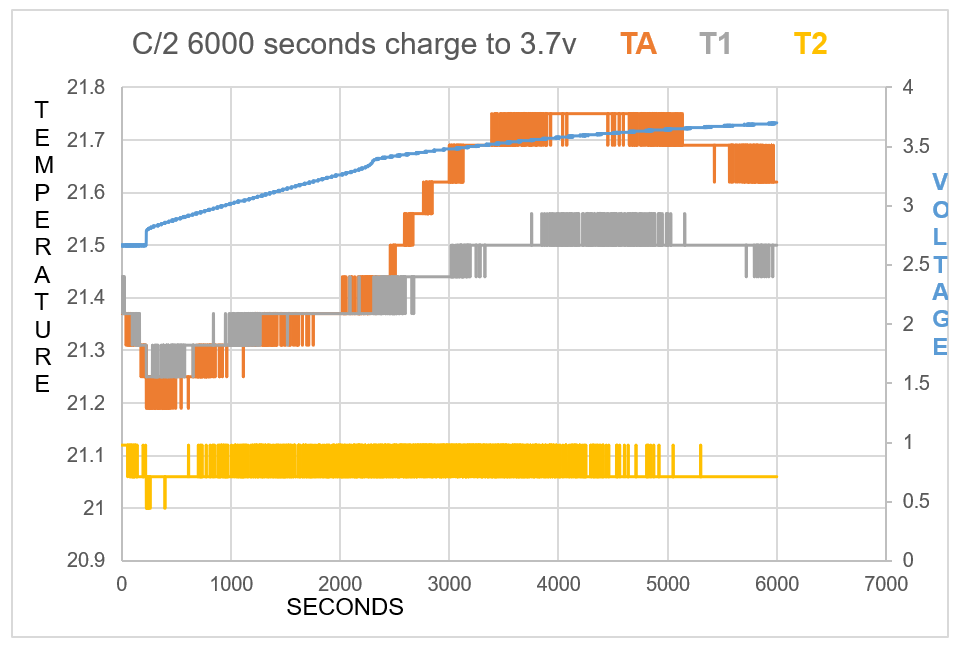
TA shows endothermic reaction before charge is engaged, and at beginning of charge for 434 seconds, becomes endothermic again at 5167 seconds at 3.67V.
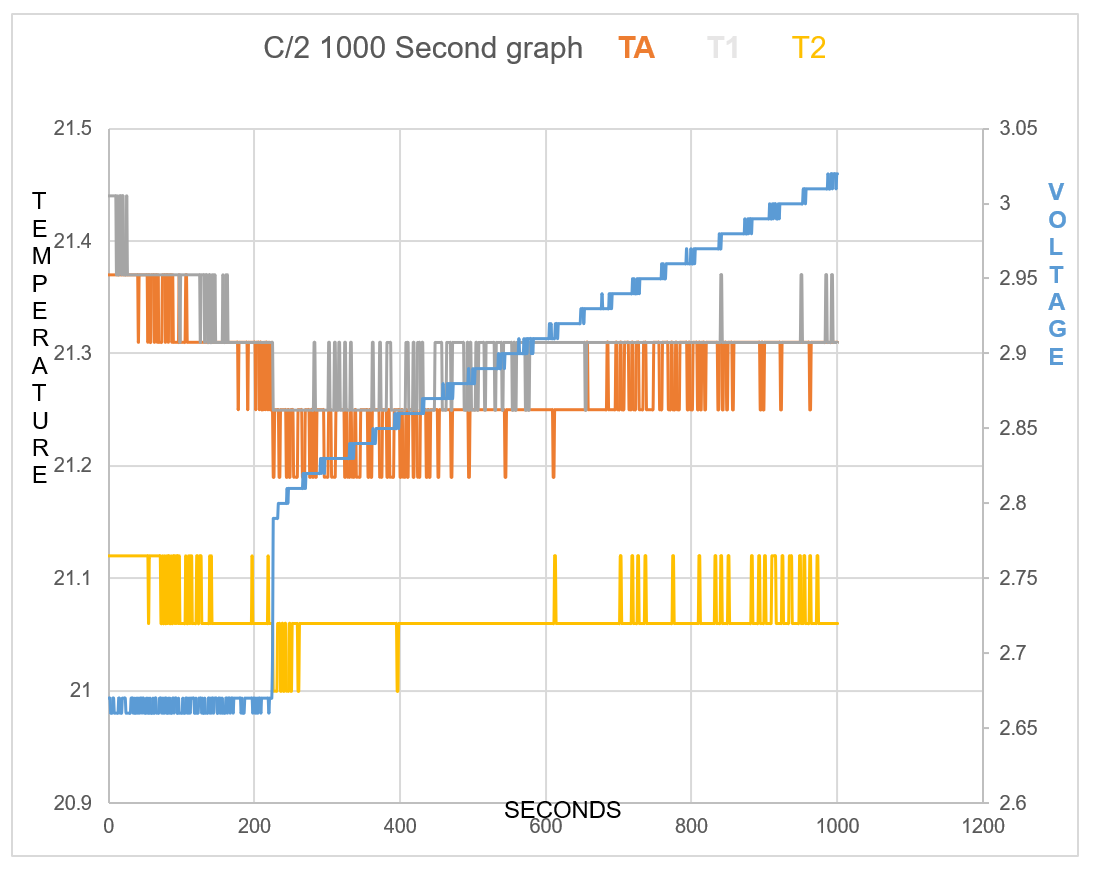
TA shows Endothermic reaction for 7mins 34secs at start of charge
TABLE 1 TABLE 2 TABLE 3
Test 1
In this experiment the Sony 18650 battery was used. There was no voltage or current applied to the battery. The battery temperature TA is elevated by 0.2 C compared to the ambient temperature T2 at the start of data collection. This is due to applying thermal heat to the battery before connecting to the circuit and data collection. The battery was connected to the circuit and the voltage and temperature data was recorded with respect to time.
positioning of temperature sensors
Results
T1 positioned 15mm from battery initially reads the same temperature as the battery sensor TA. The voltage on blue line increases through 5000 seconds. The ambient temperature T2, and T1, increase in temperature throughout the data collection. TA remains the same temperature until 1250 seconds, not following the same temperature rise as T1 and T2. TA remains a cooler temperature from 750 seconds than T1 and T2 and does so throughout the rest of the data collection time.
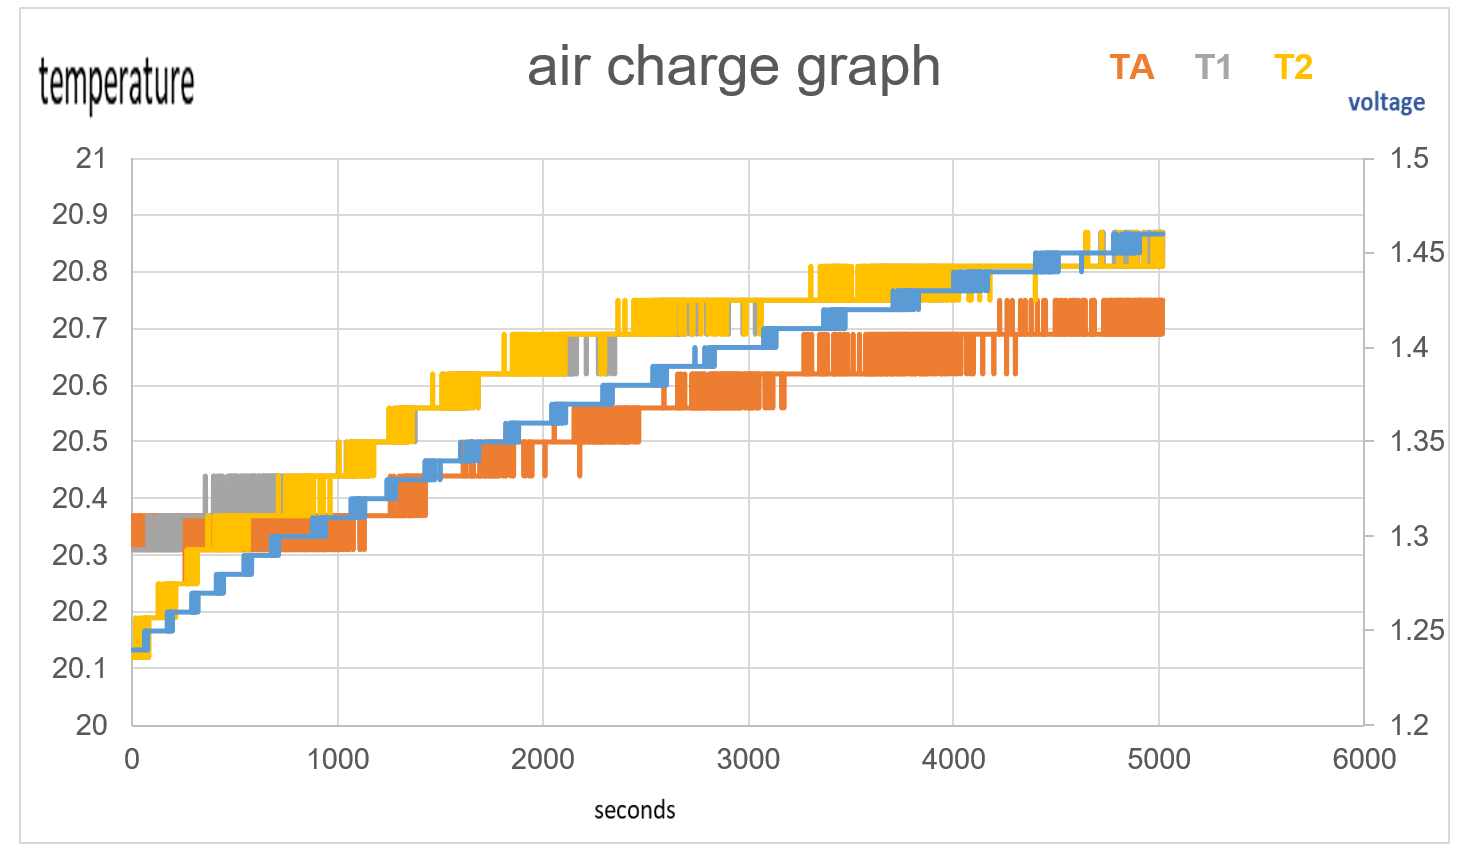
Figure 35 : 5000 seconds test 1, no voltage, no current
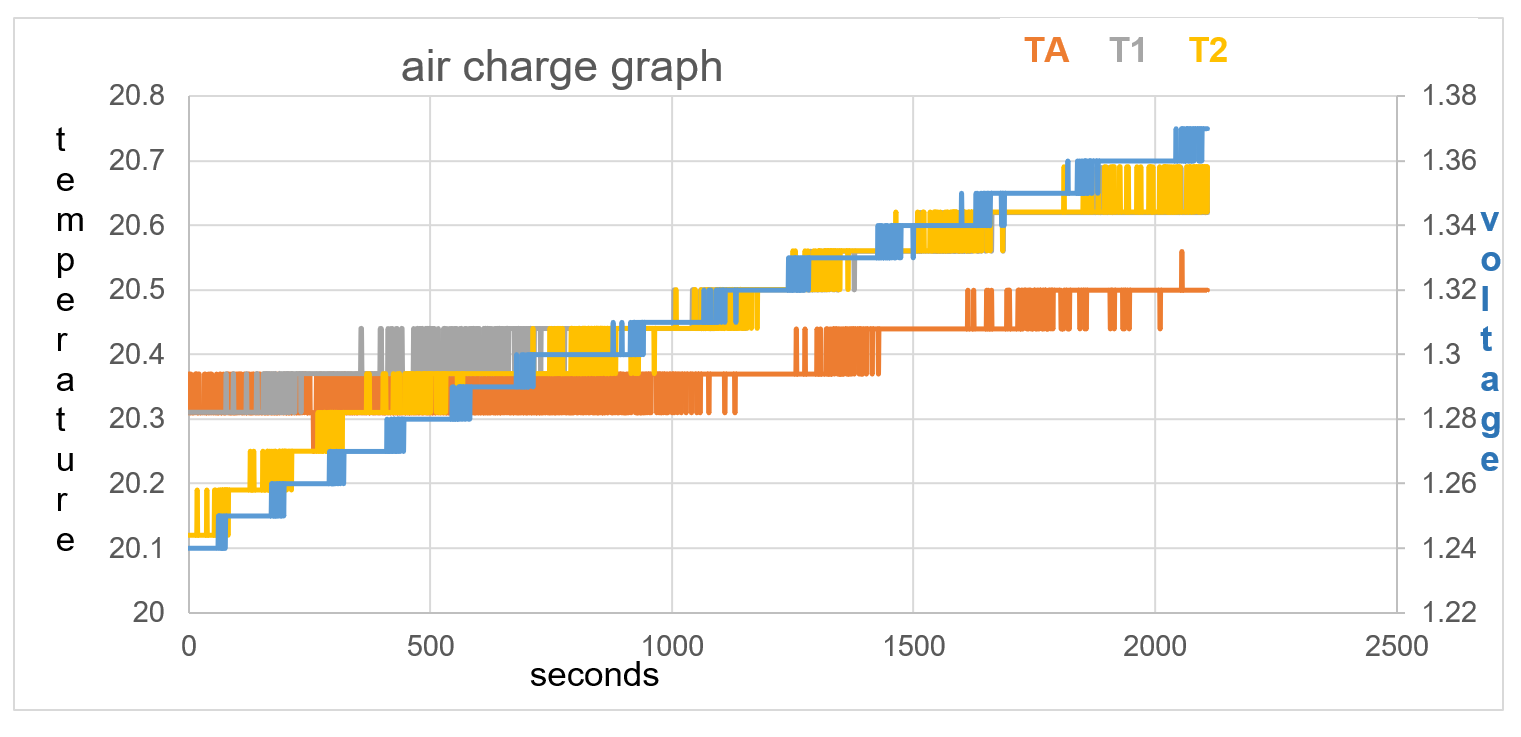
Figure 36: test 1 data collection to 2100 seconds
Voltage rise in first 500 seconds = 0.04V
Temperature stays the same on TA
Test 2
In this experiment the Panasonic 18650 battery was used, there was no voltage or current applied to the battery. The battery was connected to the circuit and the voltage and temperature data was recorded with respect to time.
The difference in test 2 compared to test 1 is that the battery temperature is higher than the ambient temperature by 1.7C rather than 0.2C in test 1. This bigger imbalance shows how TA drops in temperature by 1.4C in the first 2542 seconds and raises to 0.63V, fig 38. T1 at first is raised in temperature compared to T2, this is the thermal heat of the battery rising the temperature reading of T1. T1 continues to show a lower temperature than T2 at least until 8201 seconds as seen in fig 38.
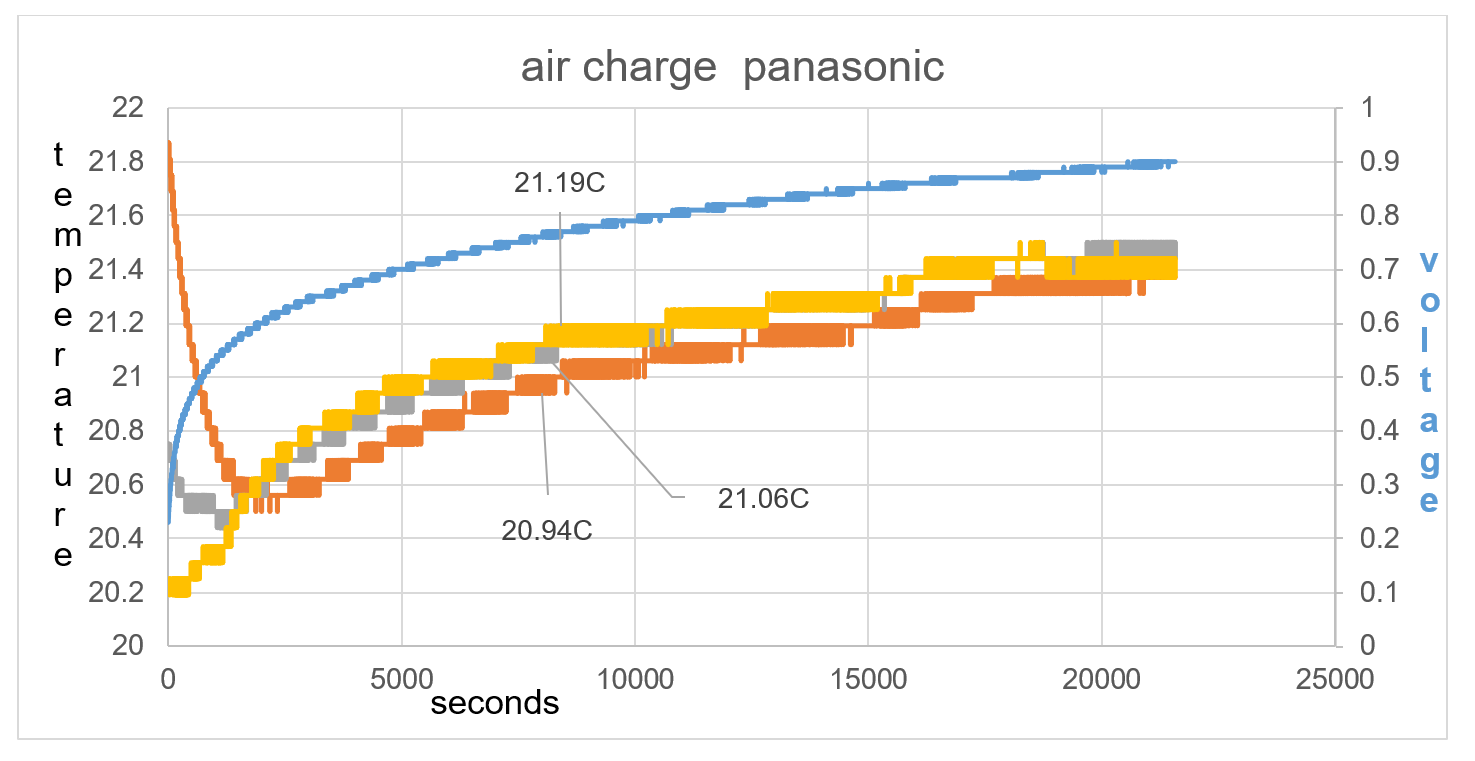
Figure 37 T1 continues to show a lower temperature than T2 at least until 8201 seconds as seen on graph
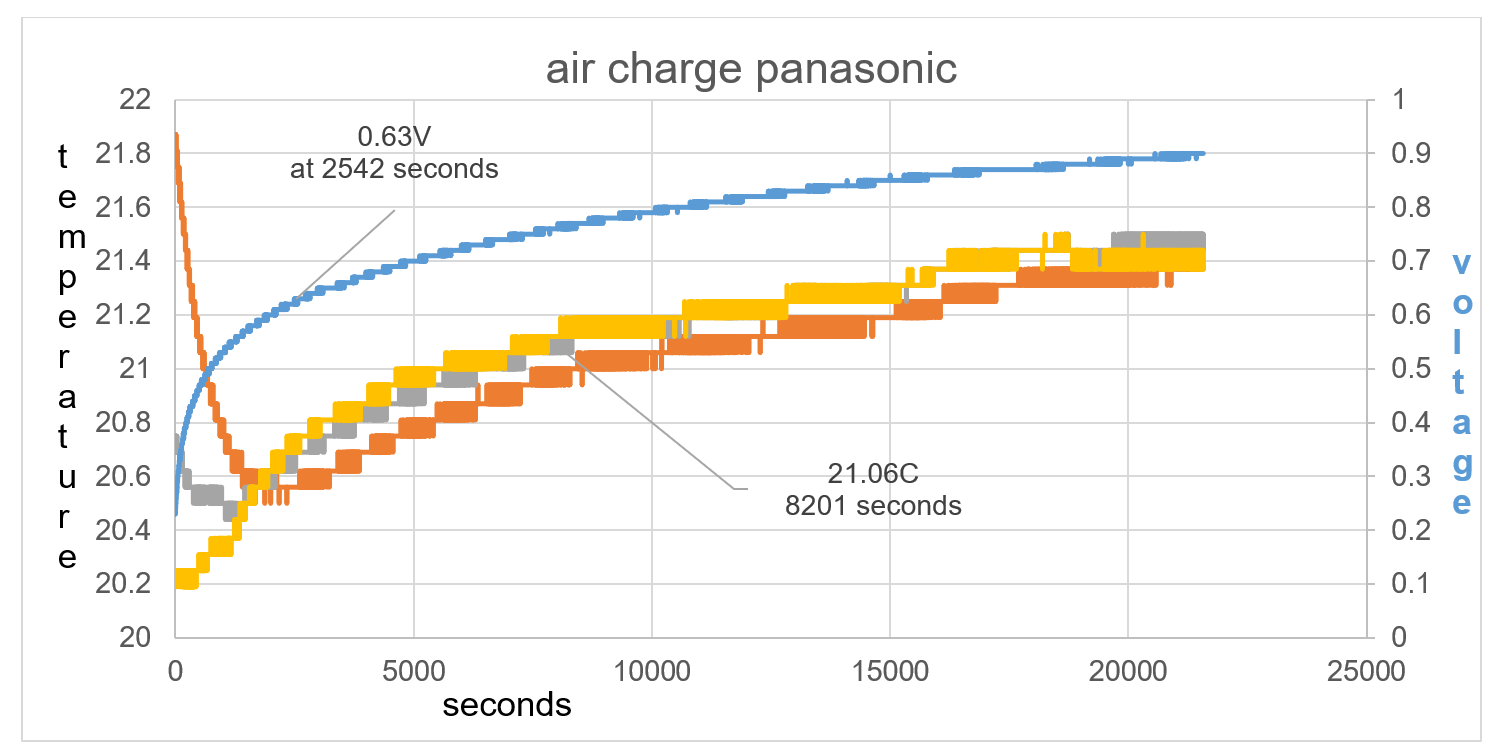
Figure 38: Overall data of time charge. TA drops in temperature by 1.4C in the first 2542 seconds and raises to 0.63V.
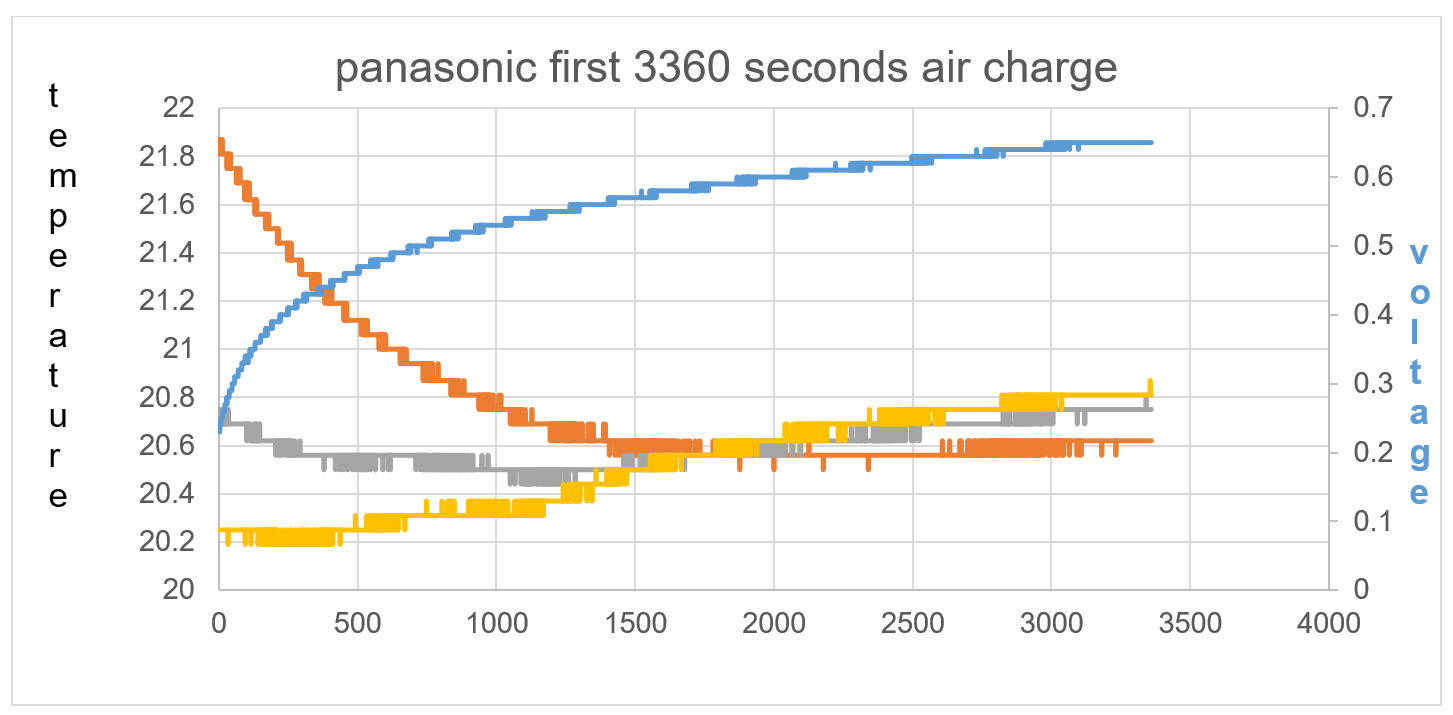
Figure 39: Imbalance of starting temperature between TA, T1 and T2 shows direction of kinetic energy flow towards the electric field charge.
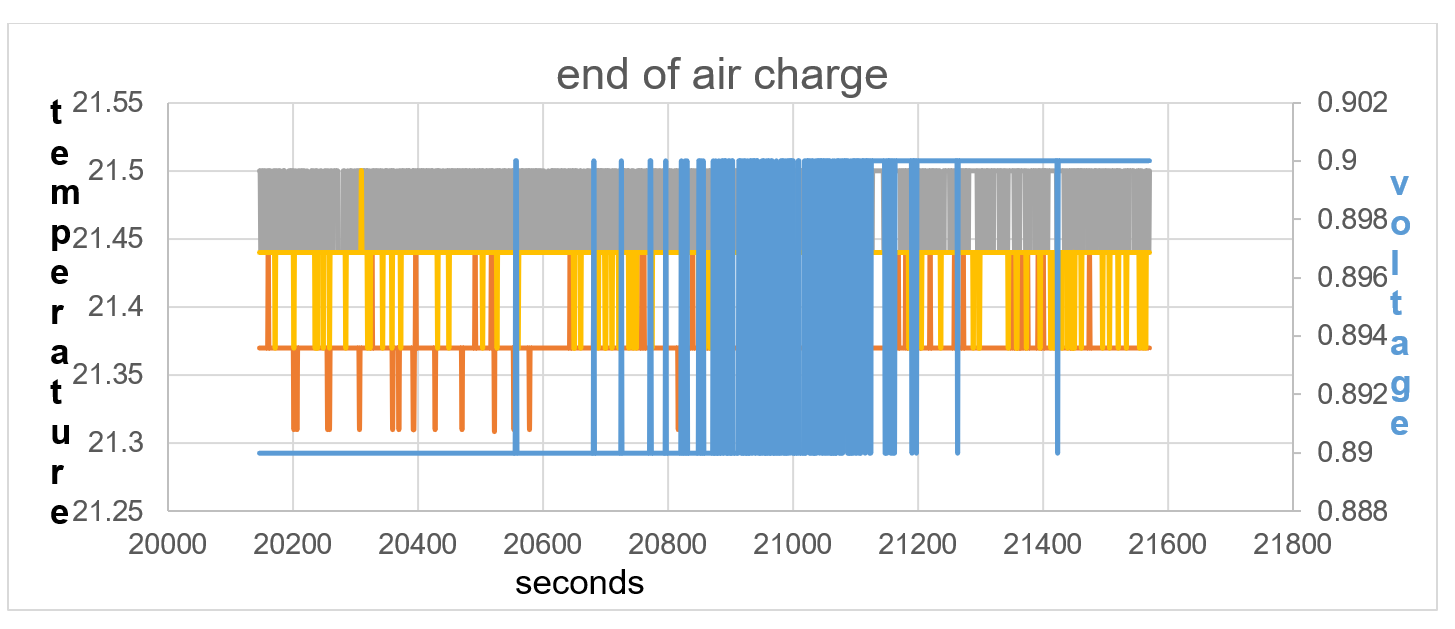
Figure40: the temperature equalises between sensors, showing equilibrium in electric field positive and negative force.
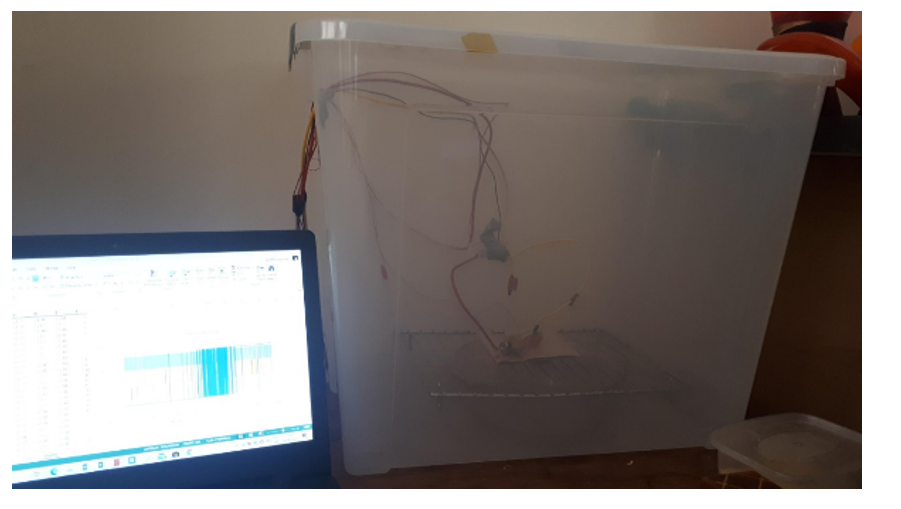
Temperature sensors, data collection and volume containment.
RESULTS
Voltage rise in first 500 seconds = 0.23V
TA drop in first 500 seconds = 0.8C
The electric field charge converts higher thermal temperature of battery compared to ambient temperature to raised voltage, and TA temperature drop in first 500 seconds.
Test 3
Samsung 18650 Battery was used. The battery was first cooled in the fridge to below ambient room temperature. The objective was to see if the charge behaved the same as when the battery starting temperature was above ambient room temperature.
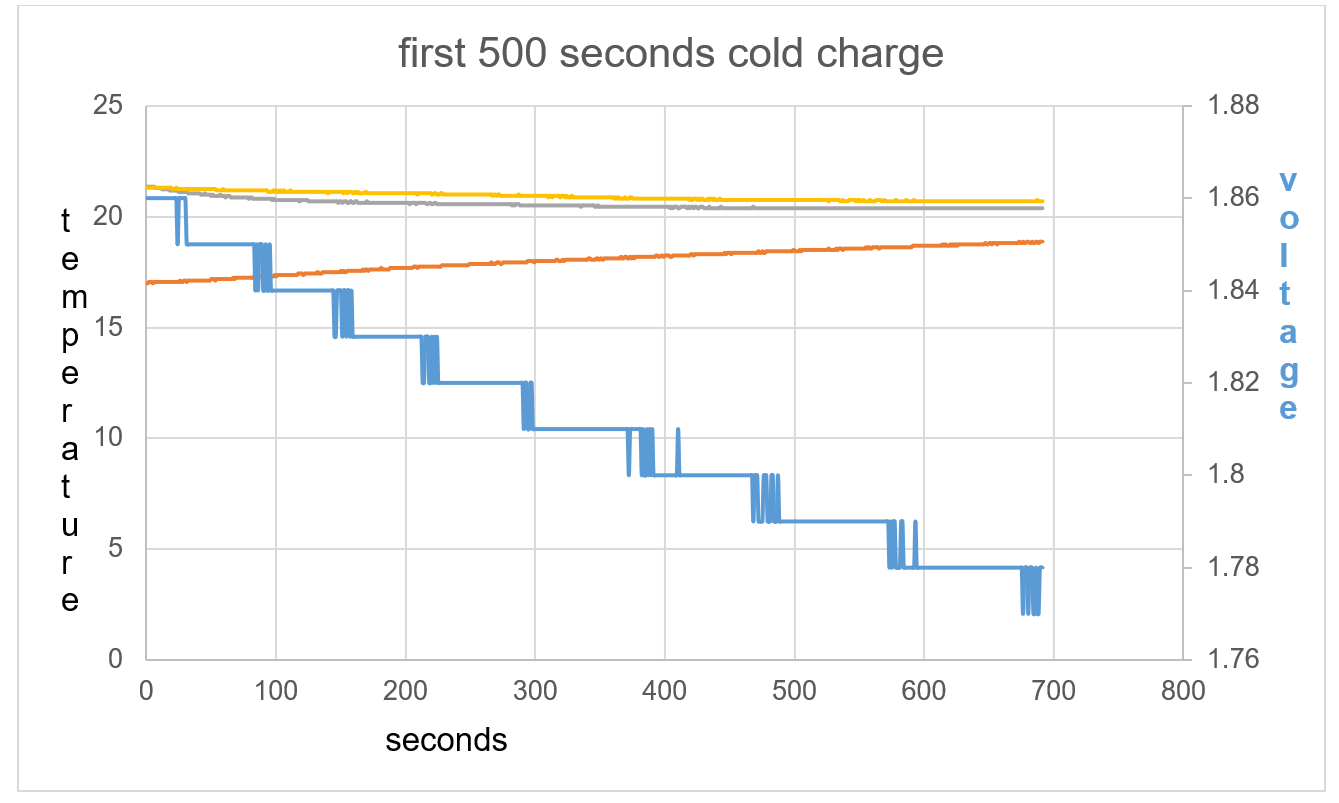
Figure 41: The opposite effect is seen compared to test 1 and 2.
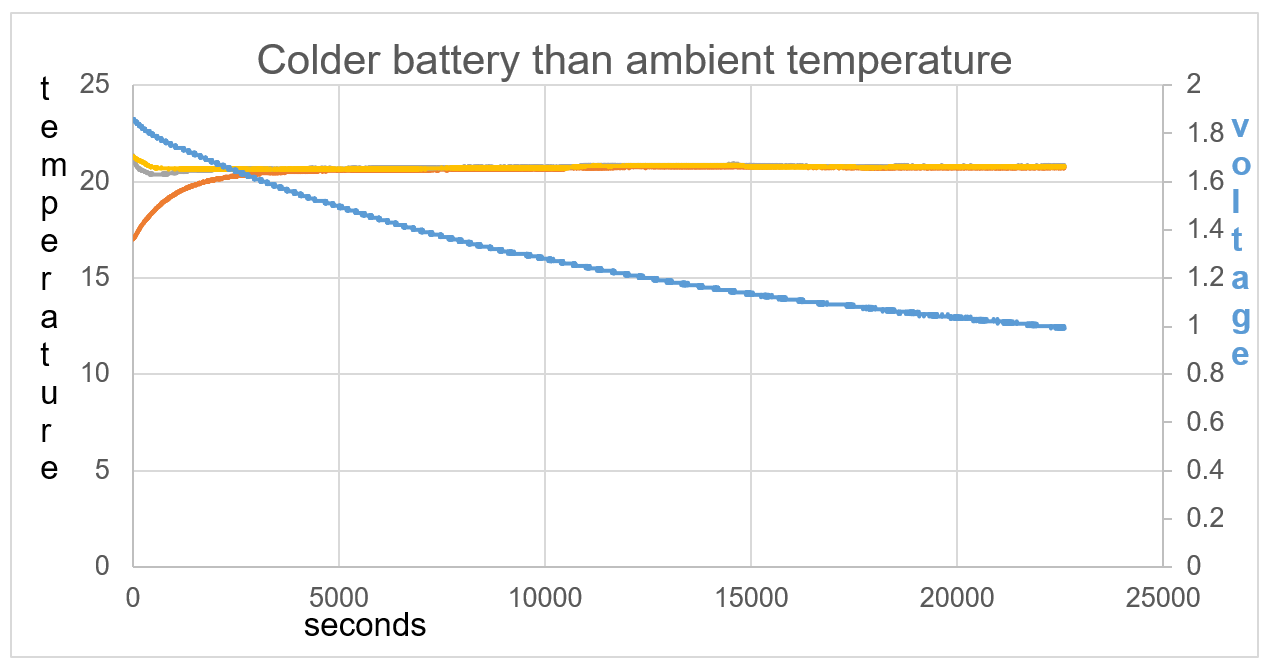
Figure 42: The battery shows an exothermic reaction with voltage decrease in respect to time
The initial exothermic action on the battery causes de-ionising and a drop in voltage. It seems when this reaction is started it will continue, as seen through 22,250 seconds.
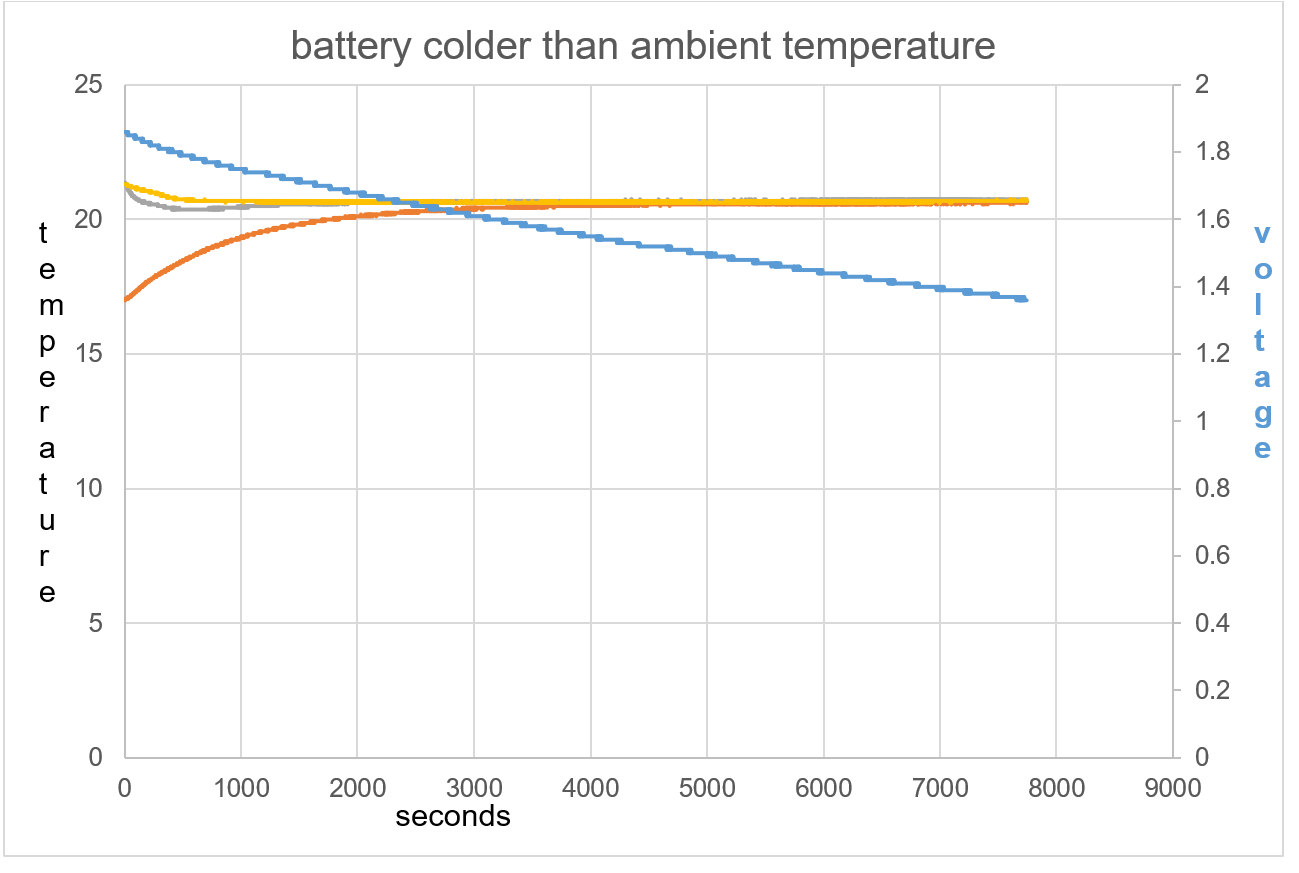
Figure 43: T1 and T2 slightly cool at beginning of data collection with TA warming.
Due to the EMF input force caused by the raised thermal temperature surroundings, the reaction is seen as exothermic in electric field immediately, and hence discharge,. The explanation must be, such a difference in temperature causes a big attraction from surrounding area towards the ionised lithium, and voltage discharge caused by frictional force, figure 43.
Experiment Conclusions for no current applied air charge / discharge for Test 1, 2 and 3.
Points of Notice
- Kinetic energy will flow from a warmer temperature to a cooler temperature
- There is no voltage or charge being applied to these tests.
- A different size temperature drop was measured in respect to time at the beginning of test 2 compared to test 1
- The raised thermal temperature measured by TA compared to T2, acts as the catalyst to the reaction just like the Photoelectric Effect does, it is the initial EMF input.
- Whilst the charge process is happening in the electric field, TA registers a drop in temperature due to kinetic energy flow into the negative electric field. as seen in Test 2 figure 37.
- The available kinetic energy in the ambient temperature within the box has an attraction reaction, negative electrons to positive lithium ions, higher pressure to lower pressure.
- The battery electric field charge is displaying an endothermic heat gain even whilst the ambient temperature within the box is rising, this can be recognised due to TA being a lower temperature throughout the self-charge and voltage rise relates to gain in kinetic energy within its electric field.
Lithium is not a very dense alkali metal and is able to ionise due to the raised thermal temperature within itself, 0.23V and 21.87C at start of Test 2 and self-charging to 0.9V and 21.44C at end of test 2. It is not until 2620 seconds of self-charge in terms of voltage rise does the battery temperature TA show an increase in temperature in line with T1 and T2. The endothermic charge is continuous until 20,577 seconds shown in fig 37. The temperature equalises between temperature sensors from 20,577 seconds to 21,565 seconds, showing equilibrium in electric field between positive and negative force.
Due to the density of lithium and using temperature sensors, we can plot exactly how an electric field will charge in terms of a sequence of events based on physics theory we already know. For example:
- Newtons 3rd law of motion gives us an understanding of equal and opposite reaction
- Boltzmann’s law gives us an understanding of amount of energy by temperature
- There are repulsive forces between identical particles, i.e. electrons
- opposite monopoles attract each other
- attractive force will be frictionless whilst endothermic
- exothermic state will be resistive and chaotic,