USW Lithium Battery Experiment
These experiments were carried out in a purpose built laboratory at the University of South Wales. It is very interesting to see how the initial charge is an endothermic charge before becoming exothermic, and then becomes endothermic again when the voltage pressure increases. This means as the ionisation of the lithium proceeds, the states of charge change from first endothermic, then exothermic, then endothermic and then exothermic. This confirms NASA results.
Method
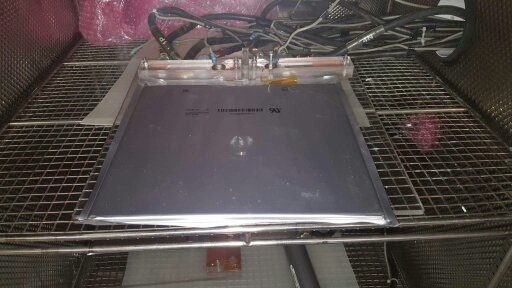
A123 battery in controlled environment: The A123 lithium battery was placed in a controlled chamber which had a controlled thermal temperature of 24 degrees centigrade. The temperature sensor is seen under orange tape. The experiment was repeated 3 times, the battery had a different centigrade starting temperature measurement prior to re-charging.
Table 1: Starting temperature of battery charge
Starting temperature of battery charge | |
Battery Charge 1 (blue line) | Battery Charge 1 = 26.8oC |
Battery Charge 2 (green line) | Battery Charge 2 = 28.8oC |
Battery Charge 3 (purple line) | Battery Charge 3 = 32.2oC |
Table 2: Charge settings
Constant current = 9.015A | Approx. C/2 charge, half the capacity | Capacity = 18.3 amp Hour |
Constant Voltage =3.6V | Total charge time: 7500 seconds (125 Minutes) |
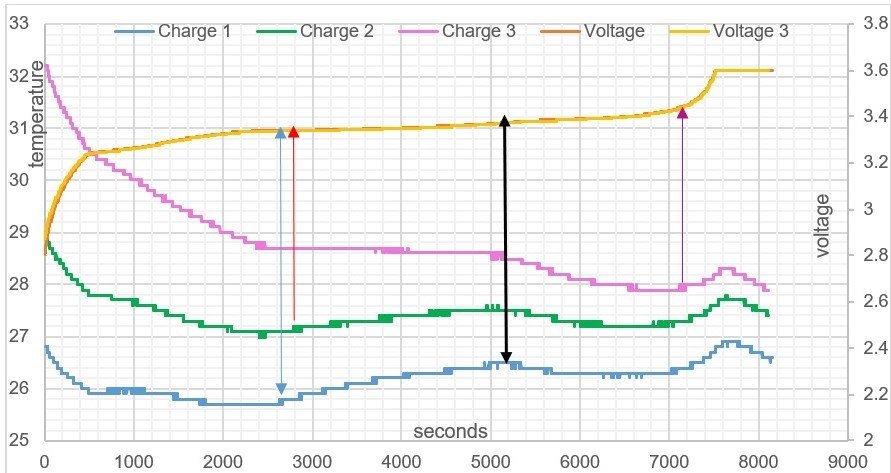
USW Graph: Battery temperature /time graph, voltage and electric field charge. There are 3 voltage lines, you see two voltage lines because of closeness of voltage readings.
Table 3: Temperature, Ionisation, and state of charge to time.
State of Charge (SOC) | 10% | 20% | 30% | 40% | 50% | 60% | 70% | 80% | 90% | 100% | |
Voltage ionisation | 2.88 | 2.96 | 3.04 | 3.12 | 3.2 | 3.28 | 3.36 | 3.44 | 3.52 | 3.6 | |
Temp 0C | Charge 1 | 26.7 | 26.6 | 26.5 | 26.3 | 26 | 25.85 | 26.25 | 26.4 | 26.5 | 26.8 |
Charge 2 | 28.8 | 28.7 | 28.5 | 28.2 | 28 | 27.4 | 27.5 | 27.3 | 27.4 | 27.6 | |
Charge 3 | 32 | 31.9 | 31.7 | 31.2 | 30.8 | 29.6 | 28.6 | 28 | 28.1 | 28.2 | |
Time/sec | 50 | 75 | 100 | 130 | 400 | 1400 | 3700 | 7200 | 7400 | 7500 | |
Table 4: Shows how long the Endothermic Electric Effect relates to the SOC of the battery electric field charge.
1st Endothermic cycle | State of Charge % | Time |
Charge 1 | 65 | 2600 |
Charge 2 | 68 | 2800 |
Charge 3 | 70 | 3700 |
Observations and Experiment Conclusions
It can be seen from table 3, the higher the batteries thermal temperature is to start with, allows for a longer time period in the Endothermic Electric Effect. This is due to initial state of ionisation of the lithium plate. At the beginning of the battery charge, all 3 batteries electric field temperature plots (seen on purple, green and blue lines in USW graph) produce an endothermic curved linear reaction showing a temperature reduction, this is a heat energy gain. (see definitions).
In this case the temperature drop shows that an amount of heat energy has been removed from the surrounding volume of gas and has been attracted into the growing electric field of the battery.
The endothermic heat energy gain and hence temperature drop represents the negative electric field current gaining force in the form of electrons and is attracted to the positive Lithium ions+. This attractive force in, is gaining energy in the form of electrons from the available kinetic energy from the supply EMF, the lithium electrons that are released from the plate due to the Photoelectric Effect, and generated from the gaseous environmental surroundings in the form of electrons.
The temperature measured on the surface of the battery decreases as the voltage pressure within the system increases, this is due to more positive ions produced, causing a bigger attractive force attracting electrons out of gas molecules in the local gaseous environment.
More ionisation of the lithium produces more positive ions and negative lithium electrons are ejected into the growing negative part of the field ; this shows how the Photoelectric Effect causes the Endothermic Electric Effect. The reaction is started with an EMF input (photoelectric effect), and electrons are vibrated out of the neutral lithium atoms by the vibration of the supply force bouncing back out of the lithium plate, and this vibration detaches outer valence electrons and produce Lithium+ ion atoms in the plate. The negative part of the electric field current gains force by populating with:
- input supply electrons,
- lithium electrons from plate,
- environmental electrons.
The lithium battery charge shows the relationship between positive ions and negative electron current, how they act upon each other during the Endothermic Electric Effect charge. How they produce an electric force and energy gain. This is due to mass imbalance and attraction and repulsion forces with respect to time.
In the electric field charge, the repulsive and attraction forces are between:
- Repulsive forces between positive lithium ions, this causes equidistant spacing of ions in lattice plate.
- Repulsive forces between negative electrons of the negative field, this causes order in the attraction to the ions whilst endothermic and chaos whilst exothermic.
- Attraction forces between positive ions and negative electrons
The metal plate will take on different states of ion charge over time as the EMF input pressure is continually placed on the plate.
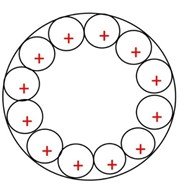
Figure 1:Metal plate from 0 to 2500 seconds.
This is how the metal plate configuration of positive atoms can be realised as the voltage pressure increases over the time of the voltage charge. One must remember that force is applied to the outside of the metal plate and conduction is not through the plate.
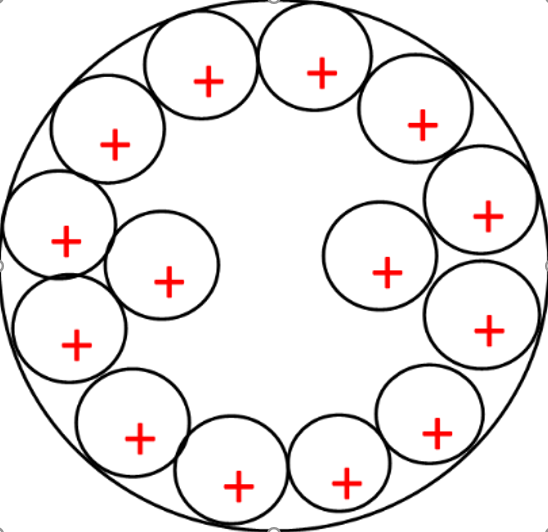
Figure 2: Metal plate at 6000 seconds with increased positive ions, the depth of ionisation as increased in the plate.
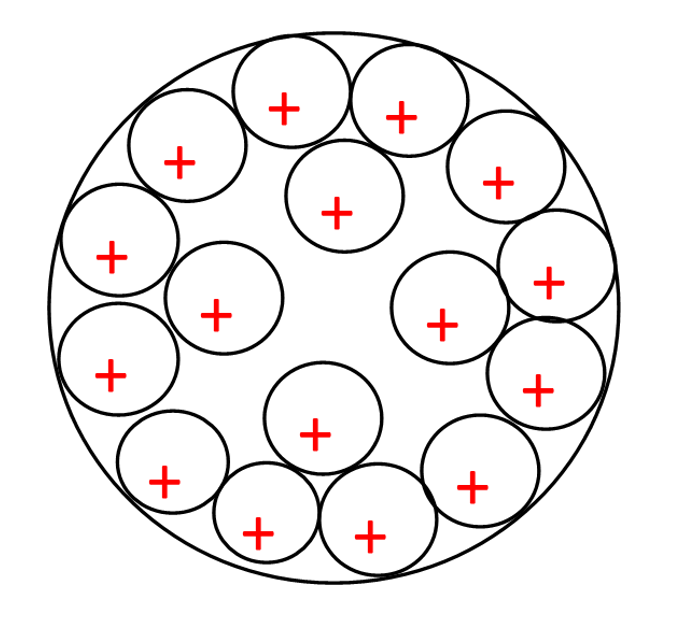 Figure 3: 7500 seconds, lithium ions at the final voltage, distributed in the plate
The atom ions will set themselves at an equidistant spacing around the plate due to the repulsive action of the atoms in agreement with electromagnetic physics theory [19] [20].
The Endothermic Electric Effect is an orderly state of charge due to like repulsion of the positive ions causing an attractive force to its opposite charge, the electrons. Centrifugal and centripetal forces are in action. A negative change in entropy indicates that the disorder of an open system has decreased, and this is observed by a drop in temperature on the battery and surrounding air.
As the voltage pressure increases in the electric field, more ions are produced in the plate, this releases more electrons into the negative current field which surrounds the positive ions.
The Effect of temperature on a voltage field
The value of Boltzmann's constant [45] is approximately:
1.3807 x 10⁻²³ joule’s per kelvin (JK-1) (Equation 3) [46].
Any given temperature has an associated characteristic energy; kinetic energy is the movement of this interaction in the form of electron exchange.
The higher the kelvin temperature of the battery, the more Li+ atoms will naturally exist in the lithium plate due to the thermal temperature. Therefore, the voltage measurement in USW graph is an indicator of ionisation, and the attractive force out from the plates is greater at the higher starting temperature that charge 3 has due to more Li+ atoms ions aligned in the lithium plate (refer to Table 5). Observing the battery charge 3 compared to battery charge 1, from USW graph, it can be seen it has more aligned Li+ atoms in its structure, making a larger attractive voltage field force out independently of the amount of voltage pressure placed into the system during the test.
Table 5: In this experiment, the objective was to show the amount of ionisation in a battery due to thermal temperature.
Starting Temperature of Battery degrees centigrade | Voltage at 80% SOC |
0 | 2.91 |
20 | 2.99 |
40 | 3.09 |
The same battery was charged to 80% state of charge (SOC). The battery received the same constant current and constant voltage pressure to achieve this SOC, the only difference was the starting temperature of the battery at the beginning of the charge. We can see how the lithium battery at 40oC has more available voltage pressure due to the kinetic energy available at this temperature, confirming Boltzmann’s Constant Law.
One can see how the starting temperature of the battery will affect the endothermic curve of the electric field. You can notice how battery charge 3 in USW graph stays endothermic throughout the charge until 7200 seconds, compared to battery charge 1 and 2.
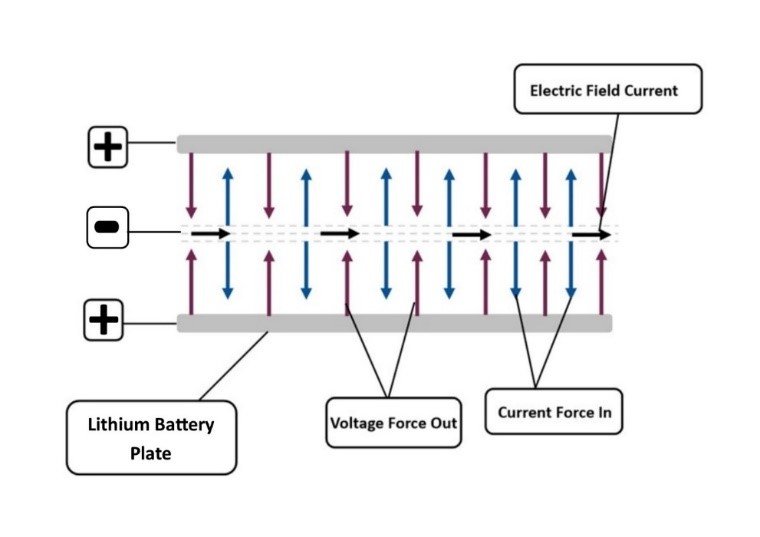
Figure 4: Electric field depiction. The relationship between voltage and current.
During the battery charges seen in USW and NASA graphs, the system gains quanta from the surrounding environment, the temperature change shows this phenomenon. The Photoelectric Effect is the catalyst to the Endothermic Electric Effect, this can be observed as the first state of an electrical charge, with positive φ ion+ force out greater than negative electric field current force in. In comparison, the exothermic process is reverse of this, with the excess of force within the negative electric field current, force in greater than the positive φ ion+ force out. When the system is in this configuration the system is exothermic. The reason the Endothermic Electric Effect of the electric field reaction is seen in the battery experiment is due to the parameters of the system; the poor conduction of lithium; the density and we have the ability to detect this with temperature measurements and by applying gas law physics. There is no reason to believe this is an isolated reaction in electromagnetism, evidence contained within this work show that it is an integral part of the charge behaviour of the electric field. Electricity is a physical reaction not a chemical reaction. If we were to consider that this observed reaction was due to some anomaly, then we would need to write another outcome for electromagnetism for this system, which would put complete doubt in all electricity physics theory. The parameters of the system allow an insight into the quantum mechanics of electromagnetism, there can only be one set of rules for electromagnetism!