Electric field Charge Characteristics
The USW experiments along with the NASA experiment can be thought of as a reliable marker in science for how to expect an electric field to charge and how the force interactions of positive ions and negative electrons within parameters of a system, define the entropy of a system.
This is a parameter-based discovery that is anything but obvious.
COMPARING NASA AND USW GRAPHS
NASA GRAPH USW GRAPH
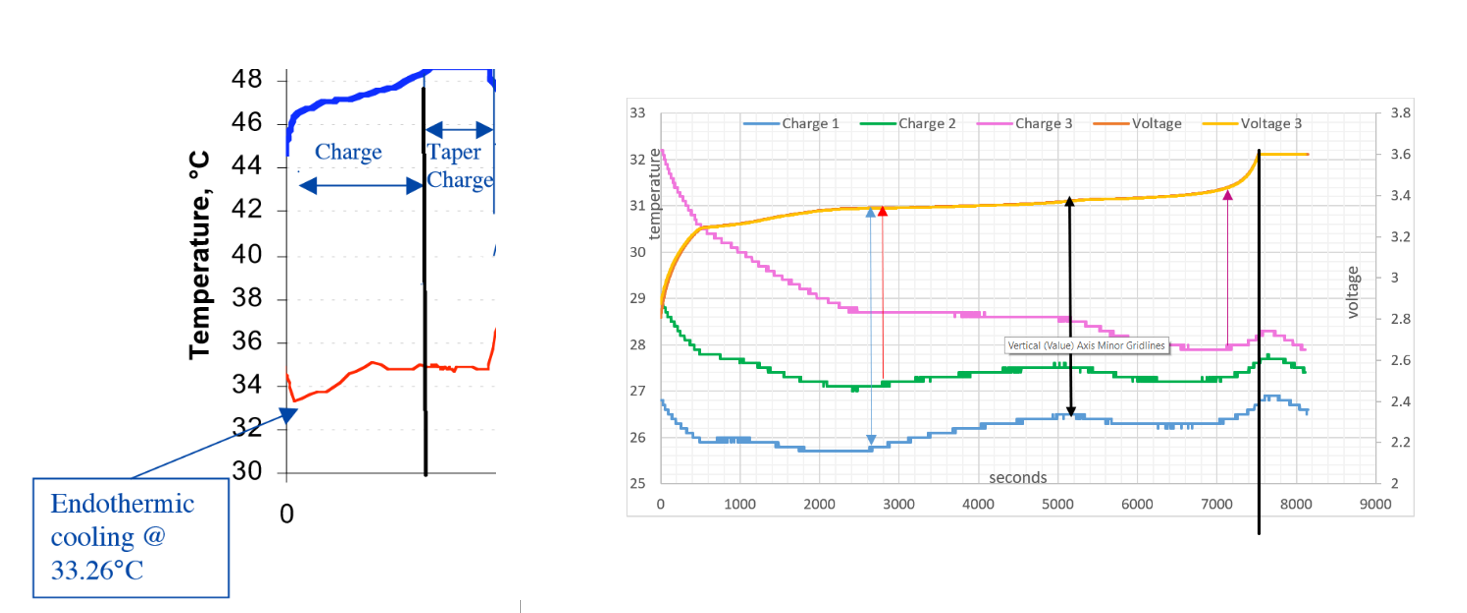
To validate the reliability and quality of the results in the NASA and USW experiments, the graphs are placed together for comparison:
- The temperature lines follow the same curves
- The black line on both graphs signifies the end of the charge cycle
- The endothermic Electric Effect is seen twice in all temperature curves
NASA conclude in [10]:
- Heat generation correlates well with temperature
- Change in equilibrium potential with temperature is used to calculate entropy.”
Defining the charge of an electric field.
Reasons how Endothermic becomes Exothermic and Exothermic becomes Endothermic in NASA and USW Figures
The continuous EMF input causes ionisation and ejects lithium electrons into the negative electric field current. The electrons are being vibrated off the atoms as the joules repulsive pressure between the atom ions builds within the lattice. The increasing voltage produces more vibration within the ions and the frequency wave out vibration increases with respect to time. As seen between 0 seconds and 2500 seconds of USW graph. This reaction initiates an endothermic heat gain response sourced from the surroundings. The electric field in all three charge curves in USW graph increase in Endothermic Electric Effect charge.
The negative part of the electric field which is attractive to the positive ions, ‘force in’ expanding outwards in surface area due to the ions joules force out increase and attraction, the mass size imbalance, and with the electrons ability to move in free space allows for the opposite polarity orderly attraction.
Notice from where the black arrow is placed on the USW graph , the voltage pressure gradient increases more rapidly between 5200 seconds to 7200 seconds. The positive ion surface area (seen as the voltage lines), as increased more rapidly compared between time 2600 seconds and 5200 seconds, here the voltage line is almost horizontal with very little increase in ionisation.
Frictional force between time 2600 seconds and 5200 seconds eventually cause more ionisation at 5200 seconds due to the frictional force into the plate by the growing electron field. AN exothermic state is the result.
The attractive force out of the positive ions significantly increases between 5200 seconds to 7200 seconds, more ionisation of neutral lithium atoms deeper within the metal lattice occurs.
As seen, between 0 to 2600, 0 to 2800, 0 to 4400 seconds respectively, the electric field charge configuration is the Endothermic Electric Effect and then again between 5200 seconds to 7200 seconds. It can be observed in charge 1, 2 and 3, the extra force out due to more positive ions populates the electric field current with more lithium electrons and environmental gas electrons in an orderly reversal of entropy, this is order.
Summary
During the Endothermic Electric Effect, the attraction of the positive ions attracts more electrons from the environment, this means more self-sourced kinetic energy into the electric field.
The Endothermic Electric Effect is a physical endothermic electric attraction reaction with the Photoelectric Effect being the catalyst to the reaction.
The Endothermic Electric Effect is recognised by a reversal of entropy and a drop in temperature on the battery surface and the environmental surroundings.
Frictional ‘ force in ’ by the negative part of the field towards the positive part of the field will cause ionisation during charge, the system will change from being an endothermic reaction to an exothermic reaction yet when there is enough frictional force, the reaction changes from exothermic to endothermic (5200 seconds to 7200 seconds USW graph).
The Endothermic Electric Effect is seen as a non-linear curve in these battery charges due to the slowdown of ionisation in respect to time during the charge.
The first Endothermic Electric Effect reaction is seen as 65 to 70% as the overall SOC in the electric field charge.
A continual EMF input force will result in more ionisation of the lithium and thermal temperature rise in the battery towards thermal runaway of the lithium, if left unchecked, this will lead eventually to the boiling and melting of the lithium.
How Secondary Ionisation Occurs
Between the red arrow and black arrow it is seen that the system becomes exothermic and ionisation of the lithium measured in volts is slowing in respect to time. With primary ionisation complete and a repulsion between atom ions around the outside circumference of the metal lattice, the frictional force must build in respect to time before any secondary ionisation will occur in the metal. Even at this low voltage pressure it is quite easily seen that the lithium is being ionised by the vibration force of the current due to opposite attraction. This continues rapidly until the blue arrow, with more voltage rise due to ionisation.
There are no cathode rays or light applied in this experiment, just an EMF force measured in amps per second.
A Larger Surface Area of Reaction Will Give More Available Electrons for An Increase in Current.
It is simple to deduce that a collision causes friction and any sort of friction in a system will increase the temperature per surface unit. Therefore, collisions will rise the temperature and the entropy of a system will increase. There are temperature differences during the charge of a system's electric field with respect to time and this had not been considered in history until now. It was not until the measurements by Naudin and NASA did this unobvious reaction become visible. The increase in current is due to attraction. In experiment USW graph, the lithium can be considered as the anode, a positive cation during the electric field charge due to its ionisation. One can see a familiar shape in the ionisation curve of the expanding electric field. First there is order in this attraction and repulsion system and this is supported by the temperature drops measured in USW graph. The attraction reaction is towards the cation and not away from the cation, this is confirmed by the measured temperature drop from the surrounding volume of gas in the NASA analysis. The area around the cation is negative, this is because of the attraction of the electrons to the positive cation and electromotive force taking place at the surface of the lithium where the opposite charges interact.
The endothermic heat gain is due to the attraction of electrons or anions to the lithium cation. This creates positive gas ions due to electron removal from the environmental gas molecules which surround the expanding electric field. Knowing about the endothermic electric effect gives us a different understanding to how an electric field is formed rather than Townsend’s theory of ‘collision’ . The endothermic electric effect shows the reaction is towards the lithium due to attraction and there is order and frictionless charging in respect to time.
Electron attraction to the lithium cations is caused by an attraction force that is greater than the bound force state of the valence bands in the surrounding molecules. This must be the case as the only changing parameter is the increasing ionisation in the lithium caused by increasing vibration. In turn, as the ionisation increases in USW graph to what is considered the saturation current to voltage pressure, the temperature of the system changes from cooling to warming. Now there is an increase in entropy and chaos in the system. The system becomes exothermic and a temperature increase is seen, the force into the cation is frictional and this signifies resistance losses at the conductor surface making the system exothermic. This friction continues until the black arrow in USW graph, from here, in respect to time there is more ionisation of the lithium occurring due to the increased vibration of the frictional state caused by continual EMF. This causes more attraction force towards the lithium cations and hence another endothermic reaction in respect to time, an increase in electric field surface area and a drop in temperature is measured with order restored to system state. As vibration and ionisation continue the system again becomes exothermic, chaotic and electrons are directed out of the electric field due to collisions. One must remember the attraction force to the lithium cation is still the factor which causes this electron chaos. The corona power loss is outwards into the environment as well as at the conductor surface. Electrons move in all directions due to angles of collision with the altered state being chaotic. The fact that breakdown voltages and discharges happen with respect to time is due to the set parameters of a system, the same can be said for energy field gain in a system before breakdown voltages are met.
This is supported by temperature observation of the lithium battery graphs.
Stages of Charge
Primary ionisation = endothermic heat gain to electric field
Saturation current reached = exothermic frictional losses from the electric field
Secondary ionisation of metal due to frictional force inwards = endothermic heat gain to electric field
Finally exothermic saturation of electric field.