NASA Experiment
In 2007, NASA designed an experiment that would plot the charge of an electric field. We can now decipher the characteristics of an electric field charge, and how this can impact future energy generator designs, including endothermic energy generators.
In this study NASA state:
“During the cycle testing, the cell exhibited an endothermic cooling in the initial part of the charge cycle. The discharge portion of the cycle is exothermic during the entire discharge period. The presence of an endothermic reaction indicates a significant entropy effect during the beginning of charge cycle. Further studies will be performed to understand the thermal characteristics of the Li-ion cells at the different operating conditions.”
Full NASA experiment can be viewed here.
https://ntrs.nasa.gov/archive/nasa/casi.ntrs.nasa.gov/20070032054.pdf
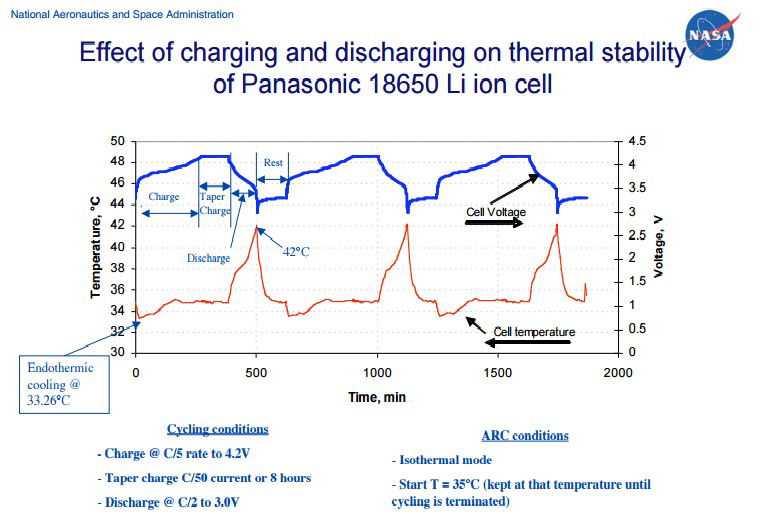
NASA Graph: NASA charge and discharge the Electric Field of a lithium battery. They repeat the experiment 3 times for continuity of data results and the symmetrical look on the graph proves the accuracy of their data collection methods. The main charge which is under discussion is the first 250 minutes of the charging cycle.
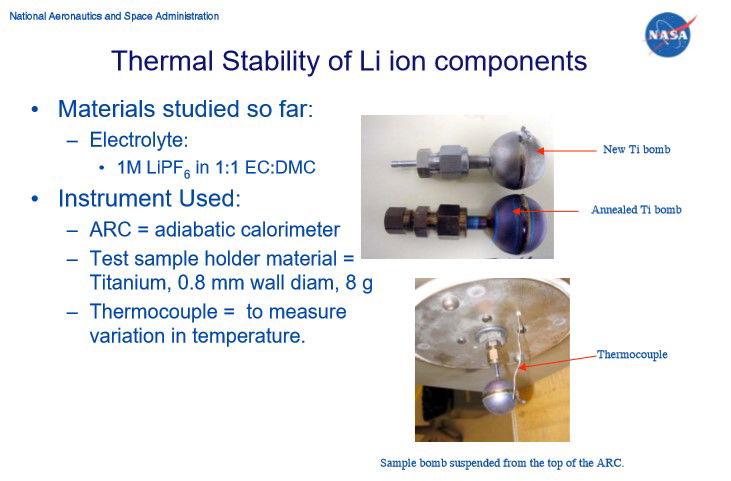
NASA ARC: The battery is placed in a Titanium bomb (Ti) within the adiabatic calorimeter arc. Calorimetry is when no heat is exchanged with the surroundings. Therefore, the Arc is a separate thermal system to the outside environment. This allows you to accurately measure the temperature of the volume of gas around the battery which is housed in the Ti bomb that is suspended within the Arc as seen.
There is an Endothermic Electric Effect event at the beginning of the charge cycle, starting temperature is 350C and reducing to 33.260C. This reaction also occurs further into the charge cycle at approximately 200 minutes (this is discussed in USW experiment). The Endothermic Electric Effect reaction happens every time the EMF is engaged as shown in NASA graph. This is recognised as an ‘endothermic cooling’ by NASA.
Due to the design of this experiment, the ideal gas laws can be applied to the NASA experiment and used as a proof of the Endothermic Electric Effect reaction.
Using Boltzmann’s constant, usually given the symbol ‘k’.
k=R/N=1.381×10−23 J K−1 molecule−1
This means that we can also write the ideal gas equation as
PV=nRT=nNkT
Because the number of molecules in the sample, N, is N =nN we have
Equation 1

where P is the pressure of a gas,
V is its volume,
n is the number of moles of the gas,
R is a constant called the ideal gas constant or the universal gas constant.
T is its temperature on the kelvin scale,
kB = Boltzmann Constant
NA = Avogadro number
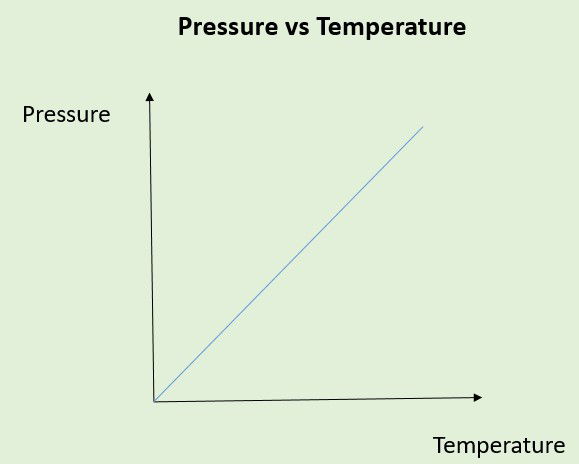
Today’s physics understanding and linear relationship for Pressure and Temperature.
Important Note: The electric field of the battery is a separate entity to the air within the Ti bomb. This is an important observation to appreciate otherwise the relationship of pressure and temperature shown above would not make scientific sense. There is attraction of electrons to the ionised lithium, the lithium ions. The negative part of the electric field will expand to a certain size depending on the amount of ionisation of the lithium atoms. The magnetic field polarises itself around the electric field. There is an exchange of heat from the volume of gas within the Ti bomb, from the magnetic field to the electric field of the battery.
Applying ‘Guy Lussac’s Law’ or also known as ‘Amontons Law’; which was later defined by Boltzmann and Planck’s physics energy equation that states:
A pressure of a fixed mass of gas held at a constant volume is directly proportional to its kelvin temperature.
There is a fixed volume of gas in the Ti Bomb. Temperature is the measurement of heat present and represents the internal energy contained within this volume of gas surrounding the battery which is contained within the Ti Bomb.
Applying equation 1: an equation to the reaction is derived during the endothermic cooling time period. One can rearrange for P, with T starting temperature (Ts) minus the temperature drop of reaction (Td) with respect to time:
Equation 2
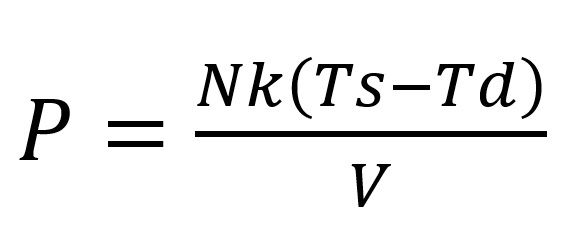
Applying equation 2 will give a reduced pressure around the electric field during the endothermic time reaction, which is measured using a thermocouple on the outside of the Ti Bomb during the temperature decreasing time period within the Ti Bomb.
This shows us that the direction of the higher energy state in the gases surrounding the system, flow to the electric field of the battery, a low-pressure area is measured around the electric field. There is a high pressure to a low-pressure flow of electrons in the open system exchange, obeying the 2nd law of thermodynamics and a proof of the mechanical process of energy in regard to an electric field charge and the 2nd law of thermodynamics. The temperature reduction within the Ti Bomb confirms this. As NASA state, 'there is a significant entropy effect', in the charge of the electric field, and this is observed by measurement of the temperature change. There is a kinetic energy gain to the electric field of the battery from the surrounding volume of gas. In this case, it will be: The total electrons ejected from the lithium atoms and the electrons gained from the gases of the environmental surroundings, which are attracted to the positive ions in the electric field, during the endothermic charge period.
We can deduce that as the temperature of the system reduces in the first 15 minutes of the electric field charge, certain observations can be realised:
- There is a fixed mass within this volume of air within the Ti bomb.
- Pressure and temperature are reduced in the volume of gas within the Ti bomb which surrounds the electric field of the lithium battery.
- There are less collisions, entropy is reduced in the volume of gas, there is orderly attraction of electrons into the electric field not chaos, this is identified by observing an endothermic reaction, the temperature drop with respect to time.
- An increased charged surface area of lithium ions+ measured in voltage (pressure) is seen in the NASA graph figure 10 on the blue line.

Nonrelativistic Kinetic energy relationships within the volume of gases